UFO HOURLY ACTIVITY IN RELATION TO “TIME USE”, “HOURS OF SLEEP” AND FLIGHTS
By CARLOS FERGUSON
«Ufology will be our main source of knowledge within a century, at least in physics, and perhaps in psychology, in the more general sense of «science of thought» (Aimé Michel)
We have known for years that the UFO phenomenon is managed with the so-called “Hourly Law”, with predominance at night (two main peaks), decreasing during daylight hours.
The greatest activity at 9 p.m., decreasing then with a second record (not as important as the first but striking), from 3 to 5 in the morning.
This was already detected by Dr.Jacques Vallée and is one of the classic patterns of the phenomenon.
In Argentina the «Time Law» is complied with as in other latitudes, in all the most complete cases possible. In my case, the results are through the statistics of cases of Pilots, Underwater Objects, photographic cases, cases from Mar del Plata and La Plata, and the largest Argentine catalog made to date: the landings.
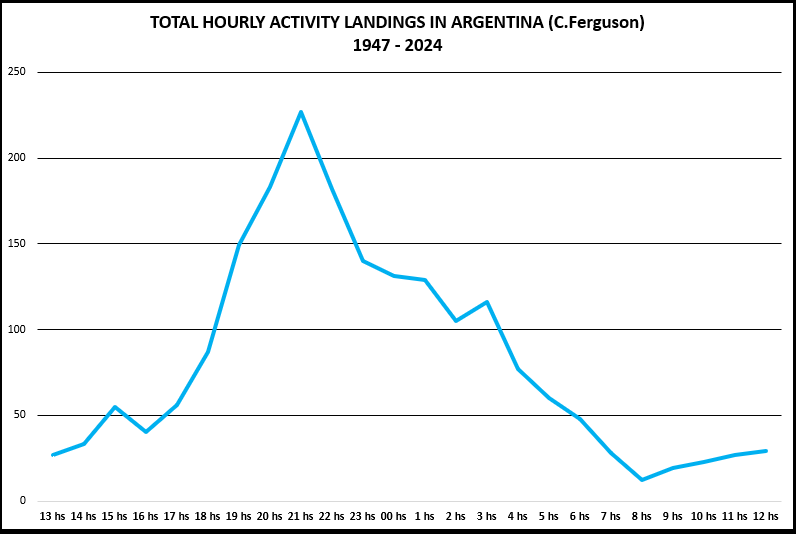
For the preceding comparison, I will use the latter (landings), since it contains 1.055 precise hourly data, being the most refined sample to date, due to having a classification system that required years of work.
The idea is to see this hourly activity in our country, based on 3 different aspects: “Time use”, “Hours of sleep” and “Total annual flights”.
TIME USE
A fundamental study carried out by Claude Poher and Jacques Vallée in 1975 shows that from 11pm to 2am, the decrease may be due to the smaller number of potential witnesses because they are in their homes.
For this reason, the analysts just mentioned created a quotient between the number of reports and the proportion of potential observers, defined as the percentage of the working population that was not at home at each hour of the day.
Then they made a statistical graph of several countries, showing the activity of observers away from home (“Use of time”) and the UFO time curve:
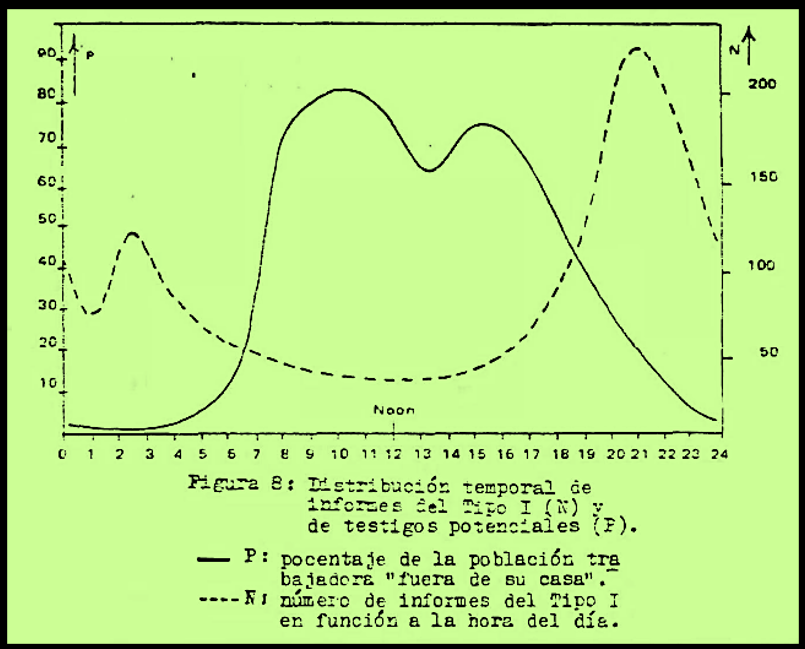
With their study, the aforementioned great analysts also estimated (always on Type 1 cases), a hypothetical number of potential witnesses if they did not remain in their homes, which would imply a figure of 14 to 1 that is, one in every 14 approaches of the phenomenon is captured by witnesses. Given that they had 2,000 type 1 cases, the phenomenon should have hypothetically manifested itself on 28,000 occasions.
The most complete catalog of landings in Argentina made to date by the author of the note, includes 1770 provisionally positive cases. If the data discovered by the great French analysts were applied to our country, we would have almost 25,000 cases where the phenomenon would have manifested itself.
Beyond this – and almost 50 years after the Vallée and Poher study – it is important to see how we can analyze it from the present, with data from Argentina. We will omit the data that occurred during the Pandemic regarding working hours, since it was an anomalous situation in the general norm.
Returning to the 1,770 cases of landing in Argentina, in 1.055 we have hourly data, and there are 426 where we only have the following data:
DAY Events = 70
NIGHT Events = 356
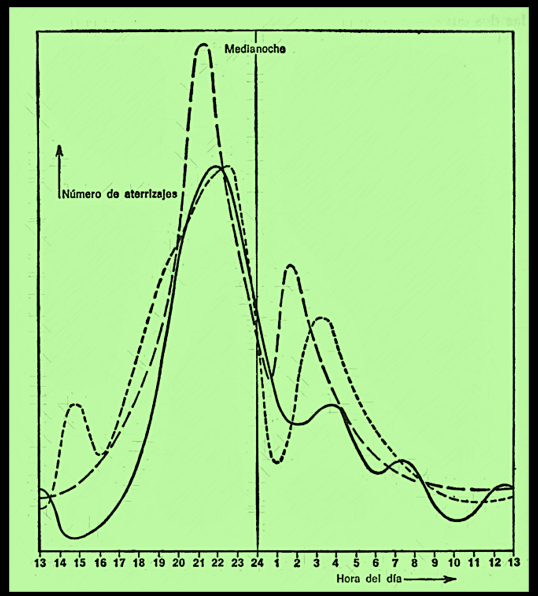
In short: in the graph below we have the sample that represents only the cases with precise time data in the Argentine case.
USE OF TIME IN THE PRESENT
According to international data, “Time Use” remains constant.
We can take references from different sources.
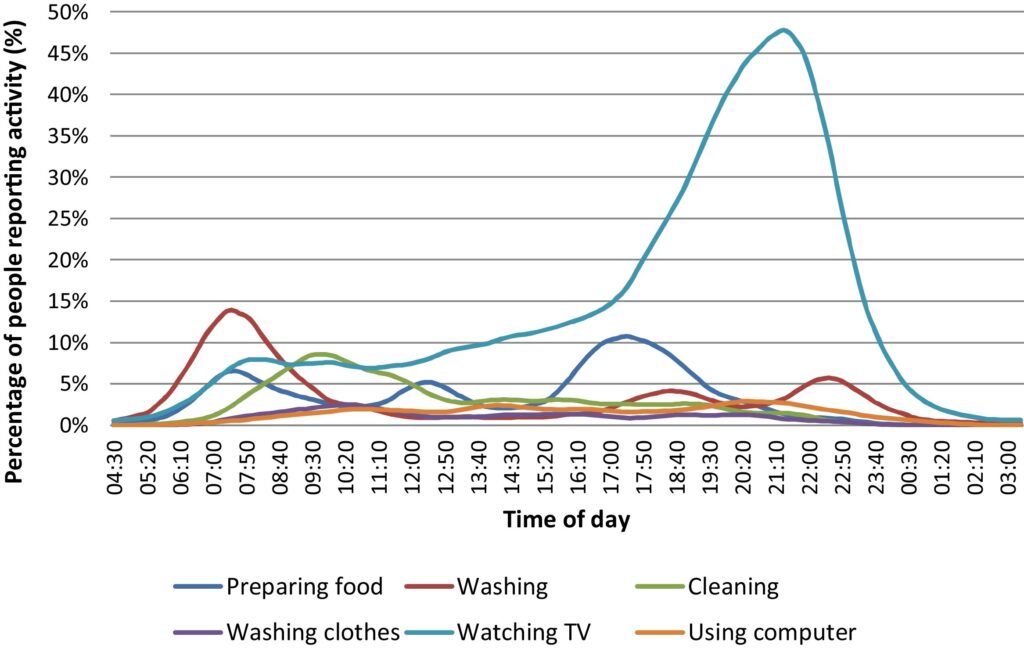
For example, analysis of the 2005 UK Office for National Statistics National Time Use Survey uses time dependence estimates for six activity codes: preparing food, washing, cleaning, washing clothes, watching television, and using a computer.
Activity codes are used here to establish a quantitative link with social practices. The focus is on social practices on time scales of different days of the week and months of the year.
Figure 1 shows the distribution of practices in terms of the centered average percentage of practices performed at different times of the day. Watching TV/listening to music is associated with the highest volume of minutes of all social practices, with a peak of 49% of respondents reporting watching TV in the hour around 9:20 p.m.
Curiously, it is the peak time of UFO activity, internationally, and constantly for decades.
Another graph from 2012 is the one made by the United States Bureau of Labor Statistics, on the use of time in that country, and which uses survey data to illustrate a day in the life of Americans by age, gender and education.
In it we once again note what was previously stated.
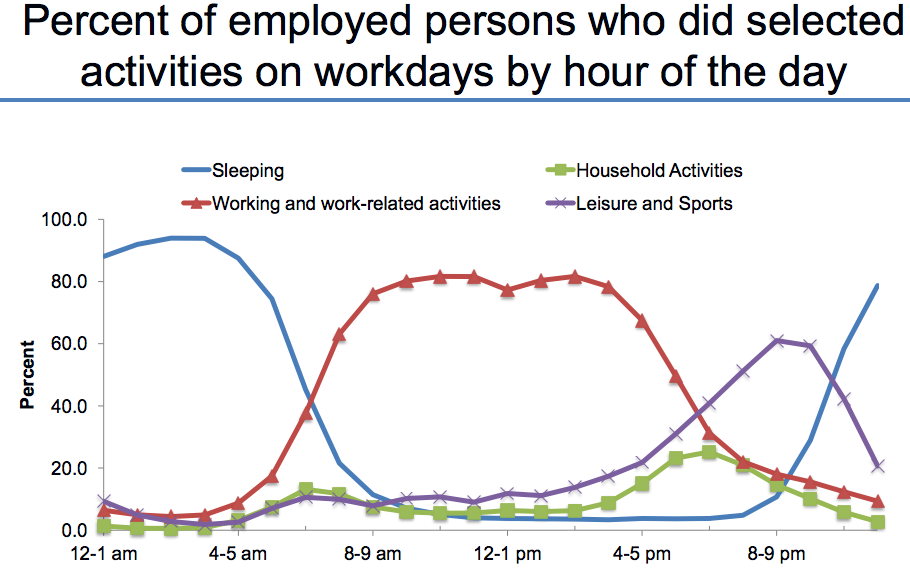
The hours of “sleep or rest” also begin from the greatest UFO activity in its two main peaks.
At Forbes we can see data from Redbooth (a client of Priceonomics, a project management software company), showing us when people were actually creating and completing their work tasks. In this data set, users have generated more than 1.8 million projects and 28 million tasks since the launch of Redbooth. By studying anonymized data, we can discover exactly when we are most likely to be productive.
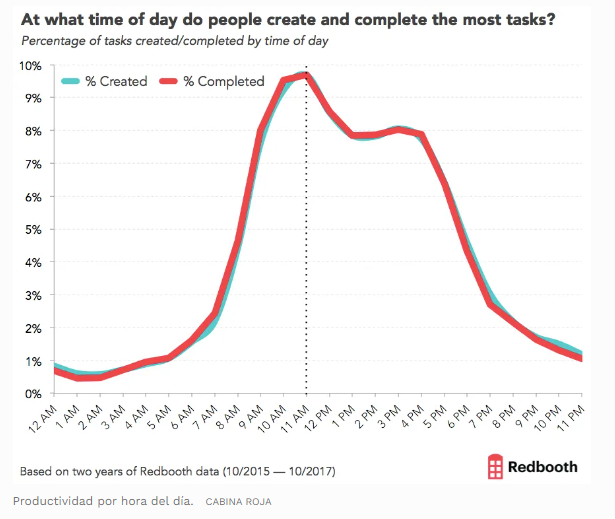
We can see that most people don’t get down to work until 7am (a typical start time) and that after 5pm (a typical finish time), work slows down quickly. Most importantly, though, it never stops completely: teams complete work at all hours of the day, and at least a small contingency of people work late into the night.
They are the potential witnesses of the phenomenon, as demonstrated in the activity they carry out at the time of the UFO observation.
Our most productive time of the day is 11 a.m., when we complete the most tasks (9.7% of all of them).
After lunchtime, our productivity drops, and it plummets completely after 4 p.m. (QUOTE 1)
TIME USE IN ARGENTINA
Argentina does not differ from any international zone.
The National Institute of Statistics and Census of Argentina (Indec) statistically mentions the time use of “busy parents” (see graph below). In orange, caring for people and domestic work. In gray, paid work and community services.
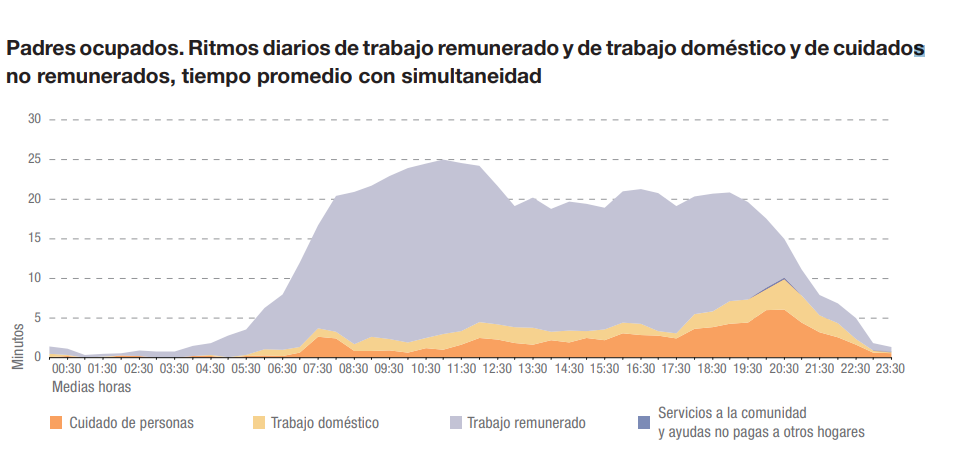
I requested a graph of “General time use” from Indec, but they have not responded from said organization. (QUOTE 2)
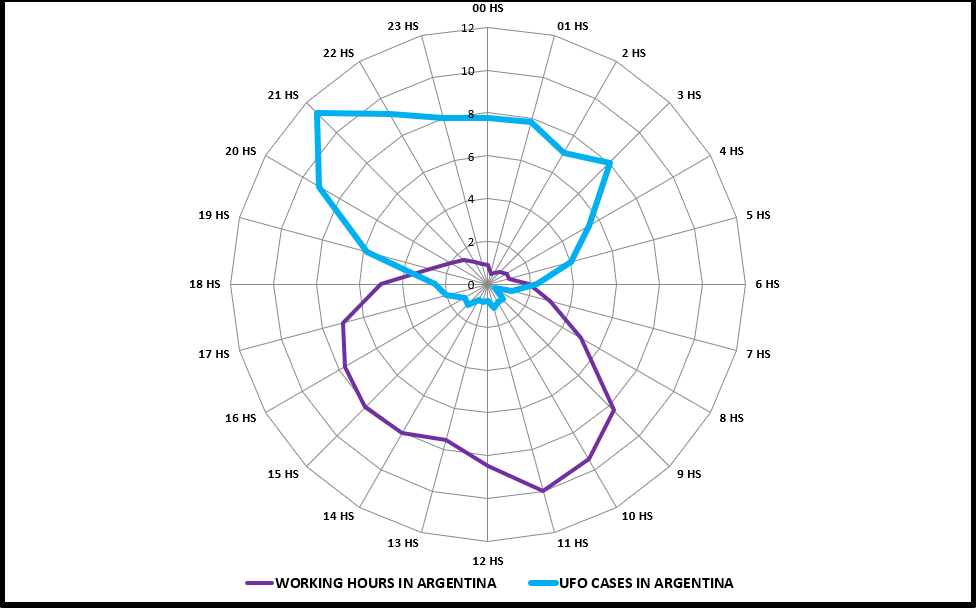
For this reason, I have put together in the following graph the percentages of work activity taking the data of employed parents from Indec.
It is clearly seen that daily work decreases when the UFO presence increases. The portion of cases where both aspects come together (as seen in the graph) are limited.
THE UFO TIME LAW BASED ON HOURS OF SLEEP
It was interesting to analyze the population’s estimate of “Hours of Sleep” with respect to hourly UFO activity.
In Argentina, according to the Public Opinion Studies Program of the Faculty of Medicine and Health Sciences of the Inter-American Open University, a survey could be carried out to find out the customs of our country. The majority of those surveyed stated that they go to sleep after midnight (52.7%), while 42.9% do so between 10 p.m. and midnight. The rest said they go to bed before 10 p.m. (4.4%). (QUOTE 3)
However, this aspect is also inextricably linked to the activity at those hours, which is usually in front of the TV or the Internet.
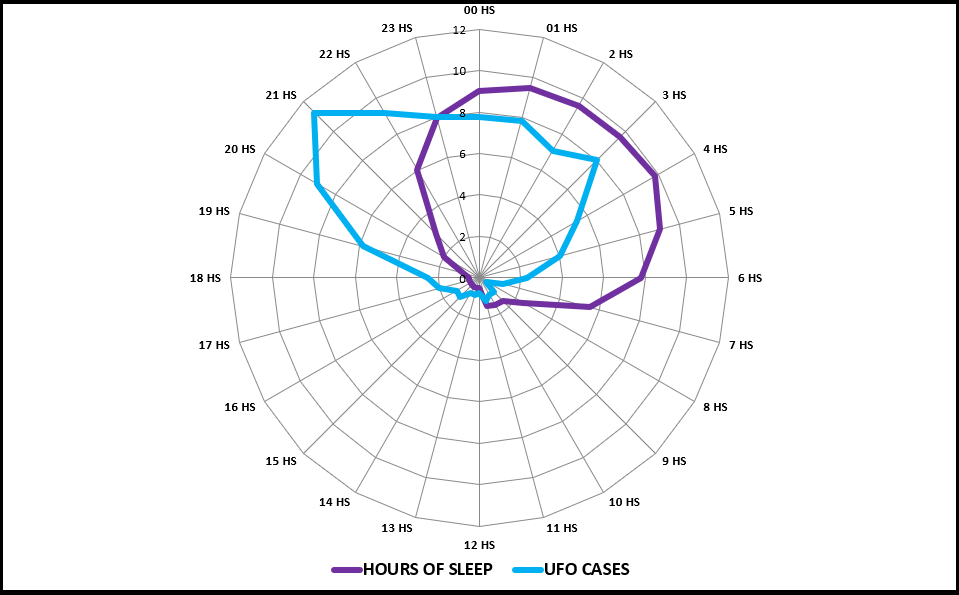
I have made two graphs with the same information, but different presentation. It brings together – based on different studies worldwide – the percentage of hours of sleep in 24 hours a day, with respect to the curves of known UFO activity in Argentina.
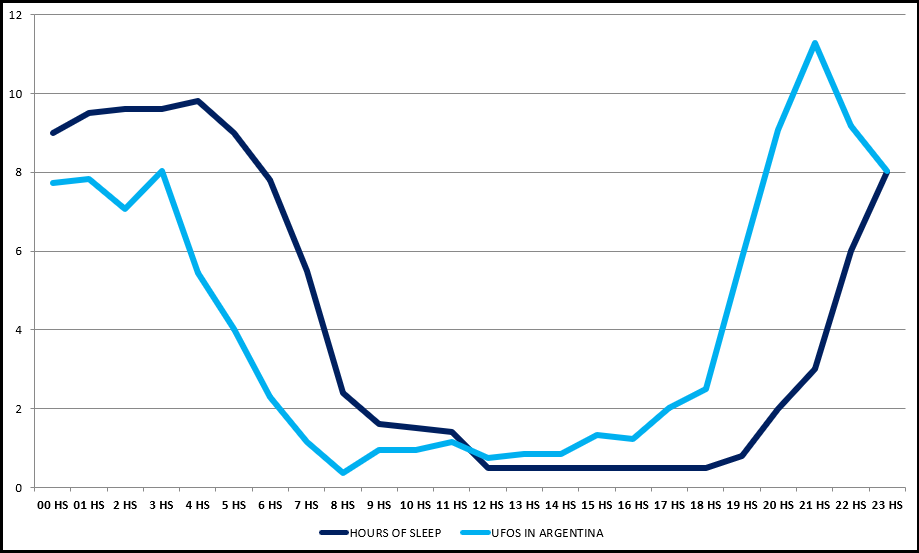
It is evident that when UFO activity increases, that is when the rest of the general population begins (as for the first maximum), with the second maximum being the most striking. The second graph also exemplifies it:
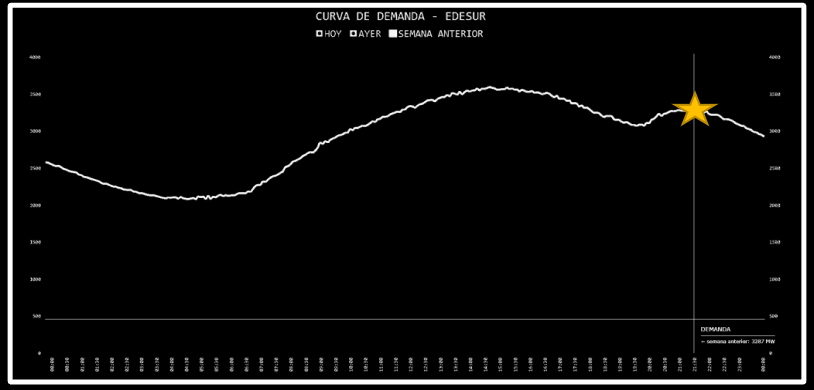
We can also contrast this with the «Use of Electrical Energy in homes».
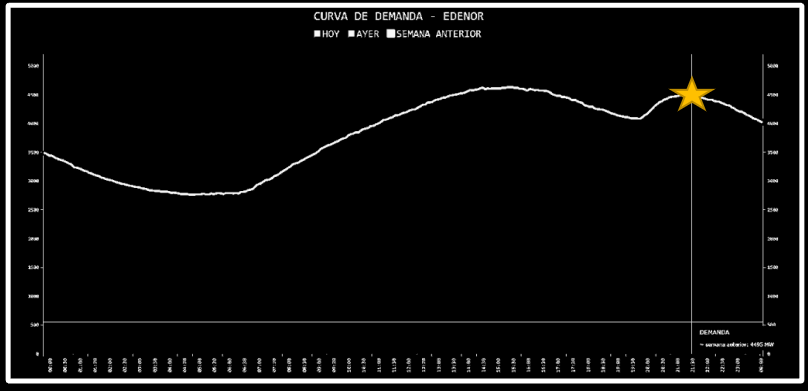
In Argentina, the data is detailed in the activities of the 2 companies that manage national electricity: Edenor and Edesur.
In the graphs that represent the use of daily electrical energy, we can see – as an example – the activity in the first days of February 2024. The point of greatest UFO activity is marked in both diagrams. It is the second highest peak of electrical activity, surely due to the presence of the majority of the population in their homes. (QUOTE 4)
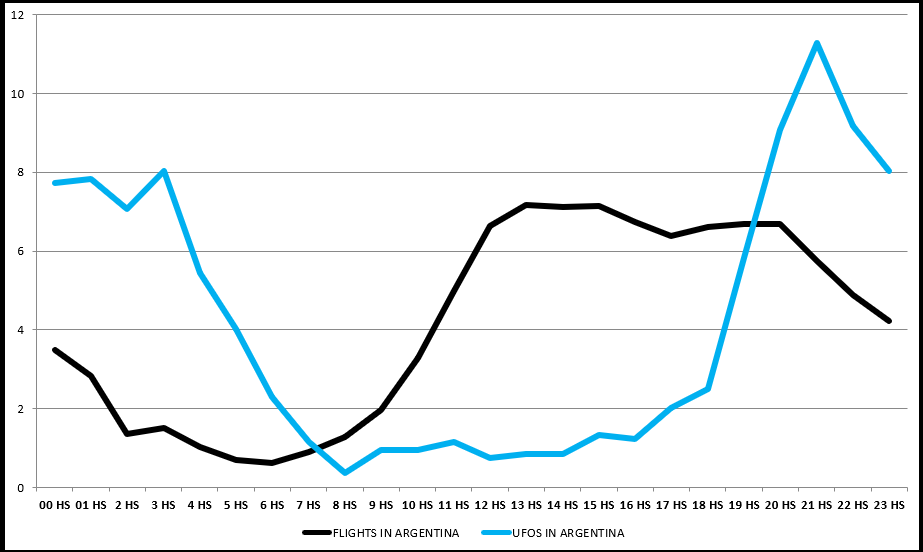
ANOTHER EXAMPLE: THE UFO TIME LAW AND CONVENTIONAL FLIGHTS IN ARGENTINA
To obtain the data, we found statistics from ANAC (National Administration of Civil Aviation) of Argentina.
To contrast the information, I have generated the percentages of all flights in 2022 in 24-hour daily activity.
That year we had 15,160 flights. Taking the activity month by month and applying the hourly distribution, we have the percentages that allow us to see its contrast with the Ovni hourly activity.
Here again we find the interesting detail: the daily flight activity in Argentina is more active in the hours when the UFO phenomenon is not.
When UFO activity decreases to its lowest point, conventional aerial activity begins.
And when our flights decrease, that is where the UFO phenomenon increases.
CONCLUSIONS
A – There do not seem to be any variations between the “Use of Time” since the pioneering study carried out by Vallée in the 70s, as expected. The maximum daily work activity contrasts with the Ovni hourly curve. Although it is true that people are dedicated to their tasks, the number of witnesses with the possibility of “seeing UFOs” is much greater than at night, but this does not happen. This shows what has already been discovered in the famous hourly law (J.Vallée): the phenomenon is essentially nocturnal.
B) – With the «hours of sleep» it is also demonstrated that the curves are consistent with UFO activity in Argentina.
C – Just as an example: the greater total hourly activity of our conventional flights from Argentina is dissonant with respect to the Ovni hourly activity.
D) – The hourly law of UFO cases applied here is not a simple accumulation of chronological figures. On the contrary, the landing catalog includes 1,055 classified reports, with a task of years to do so. When some detractors argue that we are dealing with «nighttime confusion,» they ignore this fundamental fact: from those 1,055 cases, reports of confusion and fraud have already been separated.
EPILOGUE
In a future article I will focus on other aspects related to witnesses, such as the regions and the number of observers per case.
Each statistical analysis that we do with the phenomenon allows us to delve deeper into the variables that it reveals to us.
No matter how small each piece of information may be, it will be essential to advance in the elucidation of the UFO enigma.
Arguing that with “this we will make little progress” or “we will have to wait for the phenomenon itself to manifest itself,” and remaining in the comfort of quietism, is a sign of failure and lack of scientific spirit.
Carlos Ferguson
The author: He the first advisor to the Argentine Air Force (2011 to 2017) in Ufology. Carlos Ferguson works in the Logistics areas of the Ministry of Education (Province of Buenos Aires – Argentina), and administrative tasks. He is also a professor of artistic drawing and has been dedicated to researching the UFO topic for 48 years, when, being a non-believer, had a close encounter no more than 35 meters away with a disc-shaped UFO. He has courses in Satellite Technology, Remote Sensing and Geographic Information Systems. Author of 7 books and the largest compilation of landing cases in Argentina, with classified events. He has also carried out studies on cases of pilots and UFOs in Argentina, as well as underwater objects and the most recent, on the physiological and electromagnetic effects on witnesses. Hundreds of talks and notes over almost 5 decades show him with a line of work adjusted to the parameters of statistics.
QUOTES
QUOTE 1 = “Our most productive day of the week is Monday (20.4% of tasks). / We are least productive at the end of the week (Friday, 16.7%) and, as expected, we do practically nothing on the weekends (Saturday and Sunday, 4.7%). / The highest percentage of tasks are completed in October (9.5%); the lowest percentage of tasks are completed in January (7.2%). / Autumn is the most productive season and winter (22.8%) is by far the least productive season.
QUOTE 2 = Indec is a questioned organization in Argentina, whose former transparency in data gave way to numerous misrepresentations of information, or selectivity (or curtailment), which has totally discredited it. The last example of nonsense was the last “census” carried out in Argentina, which never reflected the panorama of the exemplary censuses that were carried out in other times. Indec only surveyed certain sectors, and today we do not have data on the total number of inhabitants of Argentina.
QUOTE 4 =